Edit chart
Loading graph
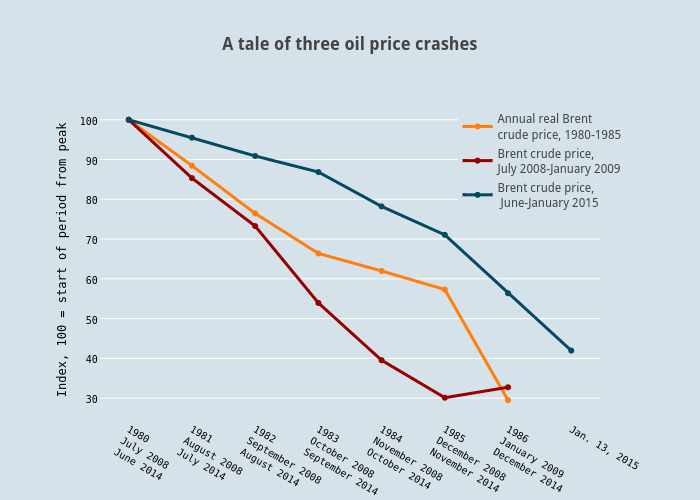
Jasonkirby's interactive graph and data of "A tale of three oil price crashes" is a scatter chart, showing Annual real Brent crude price, 1980-1985, Brent crude price,July 2008-January 2009, Brent crude price, June-January 2015; with Index, 100 = start of period from peak in the y-axis. The x-axis shows values from -0.42987633501967404 to 7.429876335019674. The y-axis shows values from 24.980629290617852 to 104.47937070938215.